- Anubhav Sarker
- Published: 02/18/2026
- Last Updated: 09/07/2026
Sales blogs will cheerfully hand you 20 or 26 metrics to monitor. Those lists are written for revenue operations teams at software companies, not for someone who also approves invoices and unclogs the office printer. Eight numbers and 20 minutes a week will tell you more than any dashboard you would have to hire someone to read.
What pipeline metrics measure, and what a pipeline is not
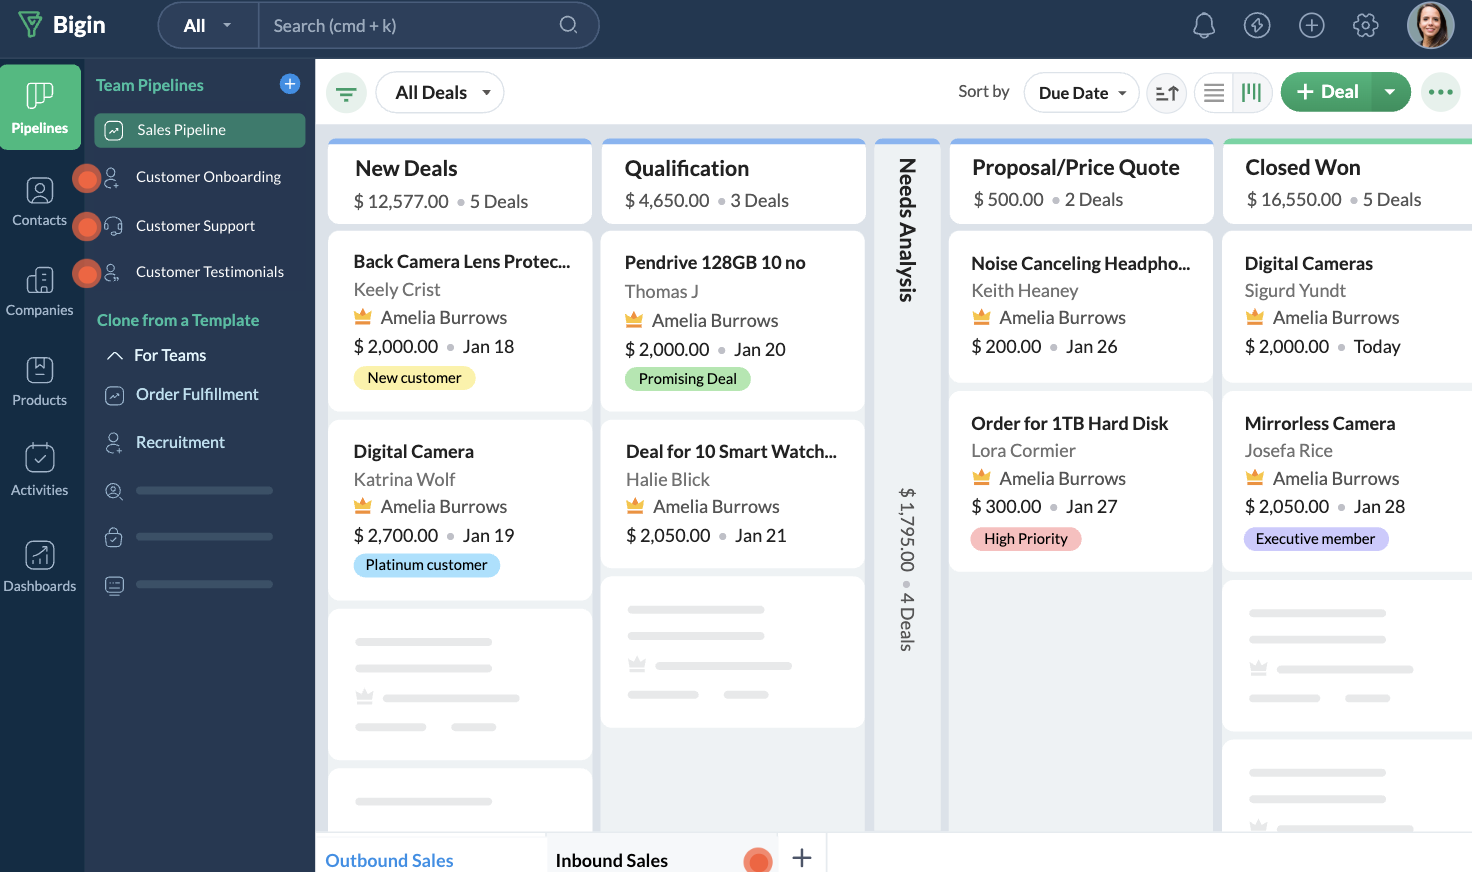
Your sales pipeline is the list of deals you are actively working on, arranged by stage: new inquiry, qualified, proposal sent, negotiation, won or lost. Pipeline metrics are measured in three ways: how much is in it, how fast it moves, and how much of it turns into money.
People mix up pipelines and funnels, and the difference matters for what you measure. A sales funnel is the whole path from stranger to customer, wide at the top, and it mostly belongs to marketing: website visitors, downloads, and email signups. The pipeline is the seller's slice, the part where a real person is pursuing a real deal with a value on it. Funnel metrics tell you whether enough people know you exist. Pipeline metrics tell you whether you will make payroll in March. This article is about the second kind.
The case for tracking anything at all
The best evidence here comes from a study that Vantage Point Performance and the Sales Management Association conducted across 62 B2B companies, published in Harvard Business Review in 2015. Companies with a formally defined sales process achieved 18% higher revenue growth than those without one. Companies that spent at least three hours a month managing each rep's pipeline grew revenue 11% faster. And companies that combined three pipeline disciplines, a defined process, time spent on it, and managers trained to run it, saw 28% higher revenue growth. The sample skews toward big firms, and correlation is not proof. But the practices in question cost nothing except attention, which makes the bet very cheap. The same study found 44% of executives admitted their pipeline management was ineffective. Most of your competitors are guessing. That is the opportunity.
The eight metrics
To keep the math concrete, the examples below follow one imaginary business: a design studio that wants $30,000 in new business per quarter, closes deals worth about $5,000, and wins a quarter of what it chases.
1. Win rate
Win rate is the share of your closed deals that you won. Divide deals won by all deals that closed, won plus lost, and multiply by 100. Leave open deals out of it; they have not voted yet. If the studio closed 20 deals last quarter and won six, its win rate is 30%.
What counts as good? Craft Ventures, the venture firm run by David Sacks, uses roughly 20% as the rule of thumb for SaaS startups. Simple, local, transactional businesses often run far higher, because by the time someone asks a plumber for a quote, they mostly intend to hire one. The only benchmark that will hold up is your own trailing number, so get one on paper and compete with it. When the win rate slides, look at qualification first, because junk entering the pipeline is the usual culprit. Then look at the price, and only then at the competition. Loss reasons, noted in one honest sentence per lost deal, explain why it was lost.
2. Average deal size
Total value of won deals divided by the number of them. The studio's six wins were worth $2,500, $3,000, $3,000, $4,000, $5,500, and $18,000. The average is $6,000. The median says $3,500, and it's telling the truth, because one pleasant surprise of an $18,000 project is doing all the work in the average. At small volumes, plan your cash on the median and enjoy the outliers when they land.
Watch the direction more than the level. A shrinking deal size usually means discounting has crept in, or smaller customers have, and both are worth catching early. Growing it by offering packaging services or attaching a retainer raises revenue without a single extra lead.
3. Sales cycle length
The days from first contact to a signed deal, averaged across your wins. The studio's average is 45 days. This number quietly runs your cash flow: a deal you start today is next quarter's money, so a slow month of prospecting shows up as a hole in revenue about one cycle later, right when you have forgotten causing it.
The cycle also tests your patience. Once you know deals take 45 days, a deal at day 100 stops being "still in play" and becomes a decision you are avoiding. More on that under deal age.
4. Pipeline coverage ratio
Coverage is the total value of open deals divided by your revenue target for the period. The common advice is to hold 3x to 4x coverage, which is just win-rate arithmetic in disguise: if you win about a quarter of what you chase, you need about 4 times your target in play.
Owners often ask how many deals should be in the pipeline, and the same arithmetic answers it in units that feel more real than dollars. The studio needs six wins a quarter at a 25% win rate, so roughly 24 qualified deals need to enter the pipeline over the quarter, about two a week. Under 2x coverage means a thin quarter is already coming, and prospecting is this week's job because the cycle-length delay is unforgiving. And a fat ratio deserves suspicion before celebration: 6x coverage is sometimes a great problem and more often a pipeline full of deals nobody has closed as lost.
5. Stage-to-stage conversion rate
For each stage, the share of deals that advance to the next one. This is the diagnostic metric, the one that turns "sales feel slow" into a sentence you can act on. Plenty of first calls but few proposal points at qualification or discovery. Plenty of proposals, but few winning points at the proposal itself, the pricing, or a follow-up habit that consists of hoping.
Compute it over a full quarter, not weekly. A small business does not close enough deals in a week for stage percentages to mean anything, and chasing weekly wiggles will only make you seasick.
6. Pipeline velocity
Velocity bundles four numbers into one: open deals times average deal size times win rate, divided by sales cycle length in days. The result is the revenue your pipeline generates per day. For the studio: 20 open deals x $5,000 x 25%, divided by 45 days, is about $556 a day, which annualizes to just over $200,000.
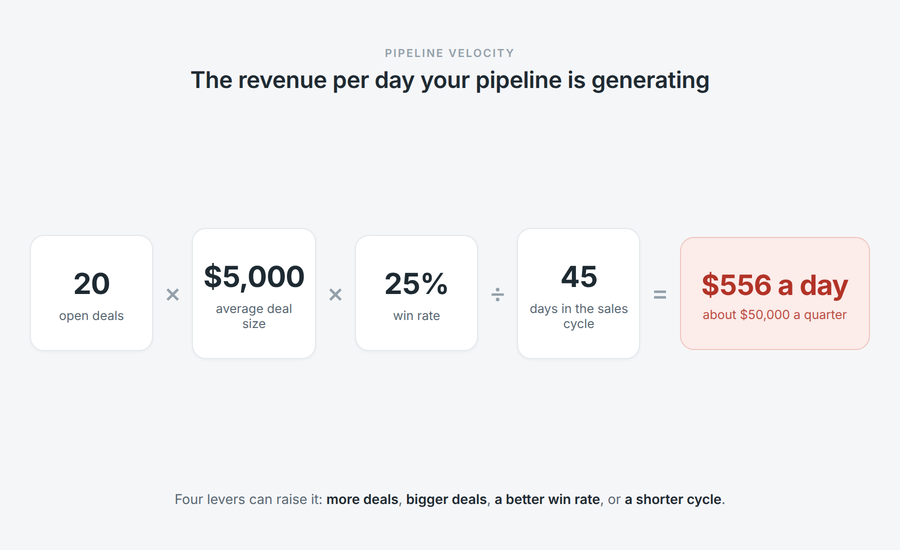
Treat the output as a trendline, not an oracle; the inputs are estimates, so the decimal places are decoration. Its real use is showing which lever moved when the trend bends, because there are exactly four ways to raise it: more deals, bigger deals, a better win rate, or a shorter cycle. Pick the lever that is cheapest for you to pull. For most small businesses, that is the cycle length, since a week of faster proposal turnaround is free.
7. Lead response time
The time between a lead arriving and a human being answering it. An autoresponder does not count. This is the metric where small businesses can beat companies 50 times their size, and there is unusually good data on it. A Harvard Business Review audit of 2,241 US companies found that the average response time to a web lead was 42 hours, and 23% of companies never responded at all. Firms that responded within an hour were nearly seven times as likely to qualify the lead as those that waited even an hour longer, and more than 60 times as likely as those that took a day. The study is from 2011; buyer patience has not grown since.
Measure the median gap between inquiry and the first real reply. If it is measured in hours, fix the plumbing: route the website form to a phone that gets answered, decide who owns new leads before they arrive, and answer in minutes. It is the cheapest competitive advantage in sales.
8. Deal age
How long each deal has been in the pipeline and how long it has been in its current stage. Age is where forecasts go to die. Deals past about twice your average cycle length close at a fraction of your normal rate, sit in the pipeline, inflating your coverage ratio, and soak up follow-up time that live deals deserve.
Set a rule and let it be a little ruthless. At twice the average cycle, the deal gets a direct question or a closed-lost date. Closing a dead deal is bookkeeping, and the ones that come back later will come back regardless.
A short warning about small numbers
Enterprise sales content assumes volumes that make percentages stable. You probably do not have them, and pretending otherwise is how owners end up panicking over noise. With 12 deals in the pipeline, one win moves your win rate by eight points. One big project doubles your average deal size. So at small volume, favor counts over percentages, medians over means, and rolling 90-day windows over weekly snapshots, and treat one bad week as weather. Three moves in the same direction are a trend. This single habit separates owners who use metrics from owners who are jerked around by them.
How often to look, and where to track it
A weekly review and a monthly one, and that is all. The weekly one takes 20 minutes and asks three questions: what has moved since last week, what has not moved in two weeks, and what is supposed to close this month.
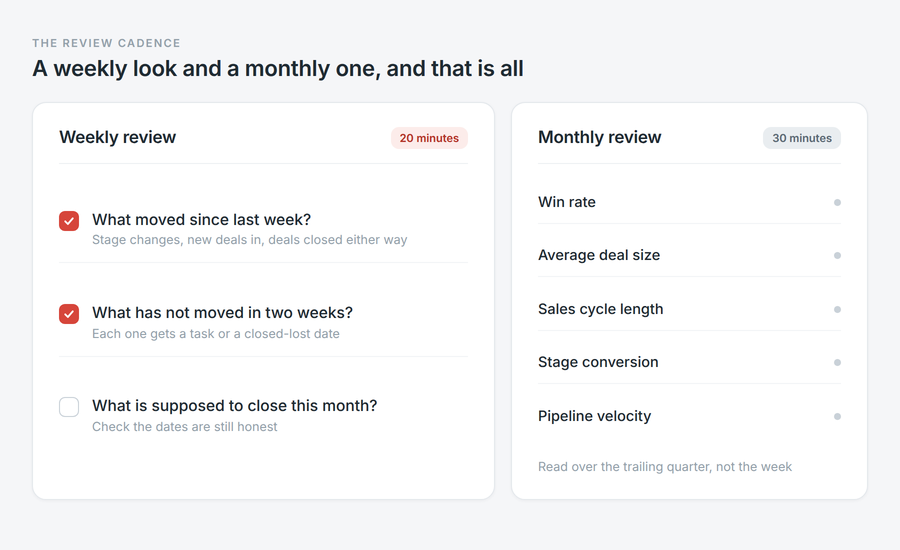
That cadence, kept boring and non-negotiable, is the habit the revenue studies keep rewarding. Monthly, spend 30 minutes reviewing the trailing quarter and reading the slower metrics: win rate, deal size, cycle length, stage conversion, and velocity. Daily tracking is for teams with a sales manager to feed; skip it.
You do not need software on day one. A spreadsheet with one row per deal and columns for value, stage, the date it entered the stage, expected close, and next step will carry you to about 20 or 30 open deals. Its weakness is memory: a spreadsheet never records when a deal changes stages, so cycle length and deal age depend on someone typing dates honestly forever, and nothing nags you when a deal goes quiet. That is the actual line where pipeline management tools earn their fee. A CRM timestamps every stage change as you drag the card, so the metrics above assemble themselves as a side effect of work you were doing anyway. Bigin is our product and was built for exactly this handoff, so weigh the source. The free plan handles real deals for a single user, and the paid plans start at $7.
Start with three, add later
Do not launch all eight at once; that is how tracking becomes a chore that dies in week three. Start with win rate, pipeline coverage, and deal age. Those three answer the owner's questions in order: am I closing enough of what I chase, is there enough in play for next quarter, and what is quietly rotting. Track them for 90 days before trusting any trend, because the first weeks measure your record-keeping, not your pipeline. Once the weekly review feels routine, add velocity and stage conversion, and you will be measuring more than most companies of your size ever do.
The metrics will not close deals for you. What they do is swap anxiety for information, so you hire when coverage says you can, prospect when velocity dips instead of when revenue already has, and spend follow-up time on deals that are alive. If you want the numbers without the spreadsheet homework, try Bigin. Import your deals, drag them across a board, and the tracking mostly takes care of itself. The trial runs 15 days and requires no card.